
What PUE Actually Measures — and Why Cooling Dominates It
Power Usage Effectiveness (PUE) is calculated as total facility power divided by the power consumed by core IT equipment. A PUE of 1.0 would mean, in theory, that every watt drawn by the facility goes directly to IT load — no overhead at all. In practice, cooling is the dominant source of that overhead. According to NEA’s Data Centre Energy Efficiency Benchmarking study, mechanical systems — cooling, fans, and related equipment — account for approximately 37% of total data centre energy consumption in Singapore, against roughly 51% for IT load itself — the single largest facility overhead by a wide margin.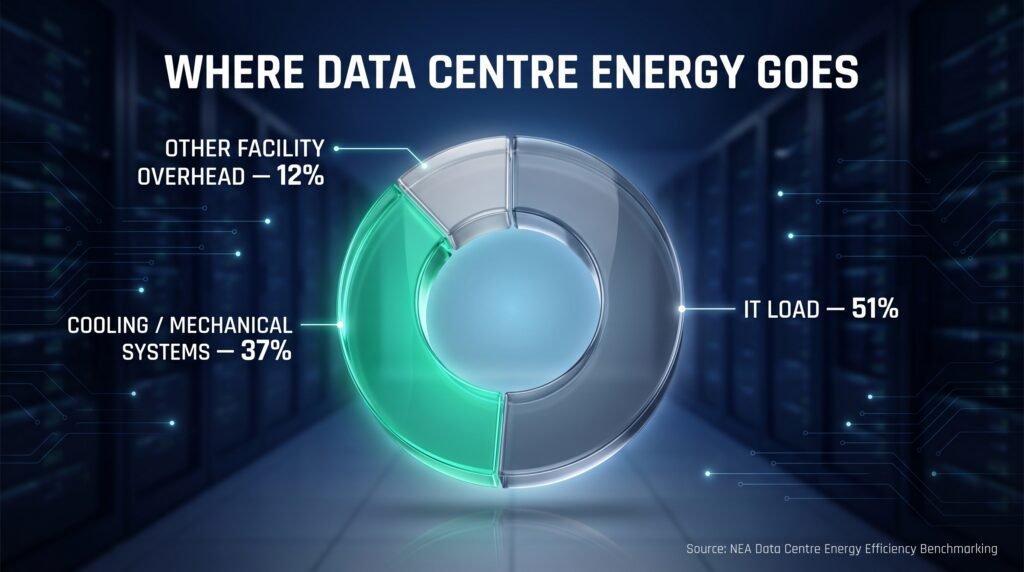
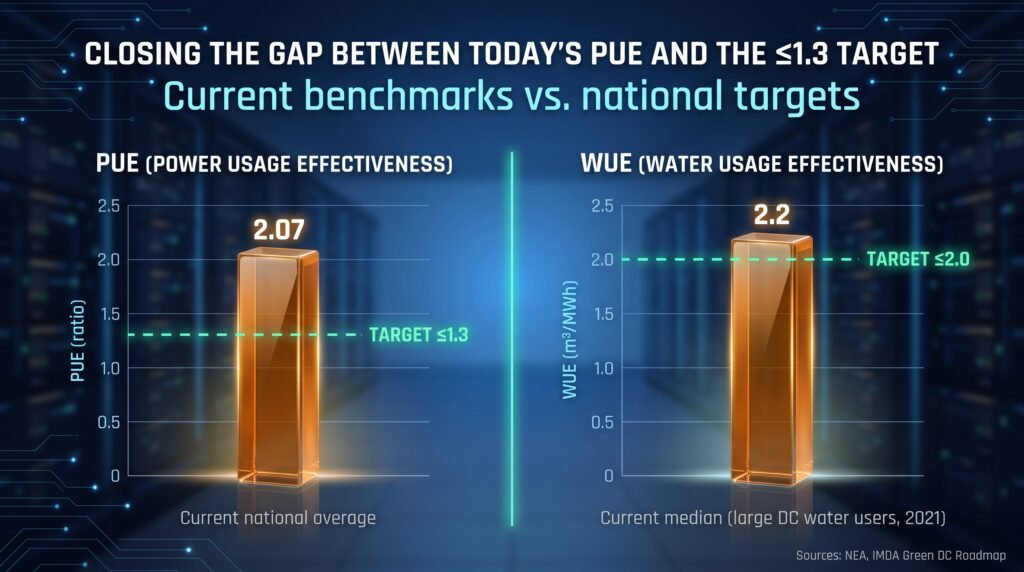
That concentration is exactly why cooling efficiency matters so disproportionately to PUE. The same NEA study — benchmarking 23 data centres — recorded an average PUE of 2.07, with water-cooled chiller systems consistently delivering the best mechanical efficiency among all cooling types measured. Against that backdrop, the government’s ambition is to bring PUE down to ≤1.3 nationally within the next decade. Closing a gap that size demands efficiency gains from every part of the cooling chain — and one of the most overlooked sources of lost efficiency hides in plain sight, inside the condenser loop itself.
How Scale Specifically Inflates the Ratio
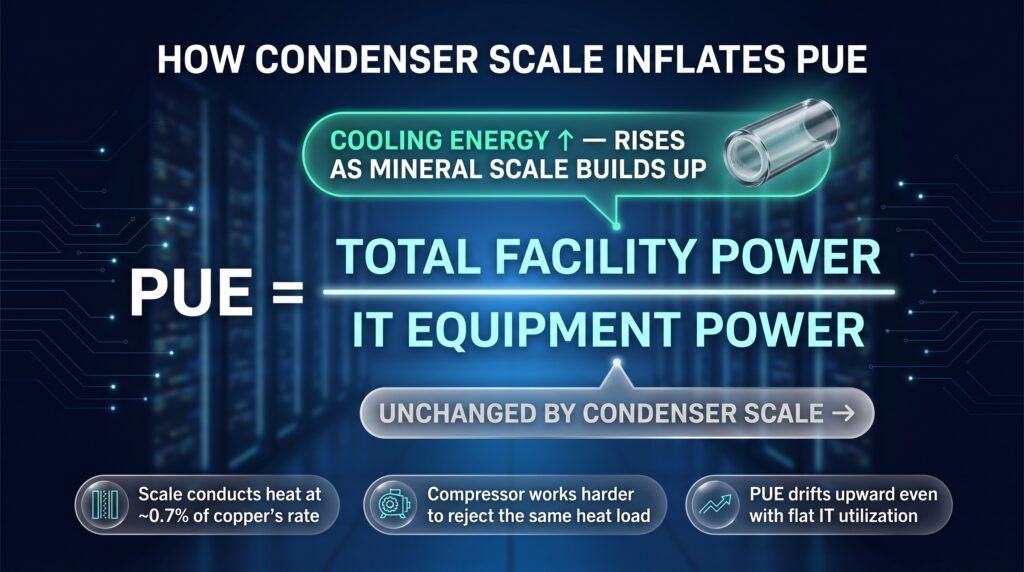
The mechanism is straightforward once you isolate it. Mineral scale — predominantly calcium carbonate — forms inside condenser tubes and insulates them, conducting heat at roughly 0.7% the rate of the copper tube wall it’s sitting on. As that insulating layer builds, the chiller’s compressor has to work harder — consuming more electricity — to reject the same heat load out of the building.
Here’s where the PUE-specific consequence comes in: that additional cooling energy draw shows up entirely in PUE’s numerator (total facility power), while IT equipment power — the denominator — is completely unaffected by what’s happening inside a condenser tube. The efficiency loss doesn’t get diluted or offset anywhere else in the calculation; it shows up directly and disproportionately as a rising PUE.
This is also why PUE can drift upward year over year in a facility with flat or even declining IT utilization — a pattern that often puzzles operators who expect PUE to track IT-side efficiency initiatives, not a slow mechanical degradation happening in the cooling plant. The number moves, but the usual suspects (server refresh cycles, virtualization ratios, containment strategy) haven’t changed at all.
The Water Side of the Same Problem
PUE isn’t the only metric affected. Water Usage Effectiveness (WUE) — calculated as total annual site water consumption divided by IT equipment energy, expressed in m³/MWh — is driven by the same root cause. The IMDA Green DC Roadmap confirms that cooling towers alone account for up to 97% of a data centre’s total water usage, and Singapore’s median WUE among large data centre water users sat at 2.2 m³/MWh in 2021, against a national target of ≤2.0.
The key lever for improving WUE in a water-cooled system is Cycle of Concentration (CoC) — the number of times water recirculates in the cooling tower before being discharged as blowdown. Higher CoC means less makeup water consumed for the same cooling load. But CoC has a practical ceiling: pushing it higher concentrates dissolved minerals further, increasing scaling risk — which is exactly why many facilities deliberately run CoC below what their water source could sustain, trading away water efficiency to stay clear of scale.
The two metrics are connected at the root: the same scale management approach that determines how much cooling energy a chiller consumes also determines how high CoC — and therefore WUE — can safely run. Improving CoC from 8 to 15, for instance, can reduce blowdown volume by roughly 5%, a material saving at data centre scale.
Metric | Singapore Benchmark | National Target |
PUE | 2.07 (national average, NEA study) | ≤ 1.3 |
WUE | 2.2 m³/MWh (2021 median, large DC water users) | ≤ 2.0 m³/MWh |
Why This Stays Hidden in a Data Centre Environment Specifically
Data centres are among the most heavily instrumented facility types in existence — DCIM platforms track IT load, power draw, rack-level temperatures, and cooling setpoints in granular, real-time detail. That level of instrumentation creates a false sense of complete visibility. Condenser tube fouling isn’t something DCIM or a Building Management System (BMS) is typically built to detect directly; there’s no standard alarm for “condenser heat transfer efficiency down 3% versus last quarter.” The degradation shows up only indirectly, as a PUE that drifts slightly worse over time — easy to attribute to weather, load pattern shifts, or general equipment ageing rather than a specific, fixable mechanical cause sitting inside the condenser loop.
Closing the Gap Between Today’s PUE and the ≤1.3 Target
The NEA benchmarking study found that Singapore data centres could reduce energy consumption by approximately 10% through operational improvements alone — with cooling system cleanliness specifically cited as a key lever. That finding sits alongside a tightening regulatory backdrop: NEA’s Minimum Energy Efficiency Standards (MEES) were extended to Water-Cooled Chilled Water Systems for existing industrial facilities in late 2025, adding compliance weight to exactly the systems this article is about, on top of the operating cost and sustainability reporting pressure already in play.
For data centre operators working toward the national PUE and WUE targets, the condenser loop is rarely the first place anyone looks — DCIM dashboards, IT efficiency programs, and containment upgrades tend to get the attention. But the physics are unambiguous: a chiller plant losing efficiency to scale is adding directly to the numerator of the metric every stakeholder in the building is watching. Non-chemical scale prevention technologies — including electromagnetic pulse-wave conditioning such as SWATS — are built on technology specifically engineered to remove that hidden penalty from the equation, restoring the chiller to its design efficiency without touching anything on the IT side of the facility.
Sources
- National Environment Agency (NEA), Data Centre Energy Efficiency Benchmarking — source for the 2.07 average PUE (23 sites) and the 37% mechanical/cooling share of total energy consumption: gov.sg
- Infocomm Media Development Authority (IMDA), Green Data Centre Roadmap (30 May 2024) — source for the ≤1.3 PUE national target, the WUE 2.2→≤2.0 m³/MWh target, and cooling towers accounting for up to 97% of data centre water usage: gov.sg
- National Environment Agency (NEA), Minimum Energy Efficiency Standards (MEES) circular extending coverage to Water-Cooled Chilled Water Systems (Circular NEA-CMD-CIRCULAR-ECA-00004-2025)


