
What WUE Actually Measures
Water Usage Effectiveness (WUE) is calculated as total annual site water consumption divided by IT equipment energy, expressed in cubic metres per megawatt-hour (m³/MWh). Lower WUE means better water efficiency. According to the Infocomm Media Development Authority (IMDA) Green Data Centre Roadmap, Singapore’s median WUE among large data centre water users was 2.2 m³/MWh in 2021, against a national target of ≤2.0.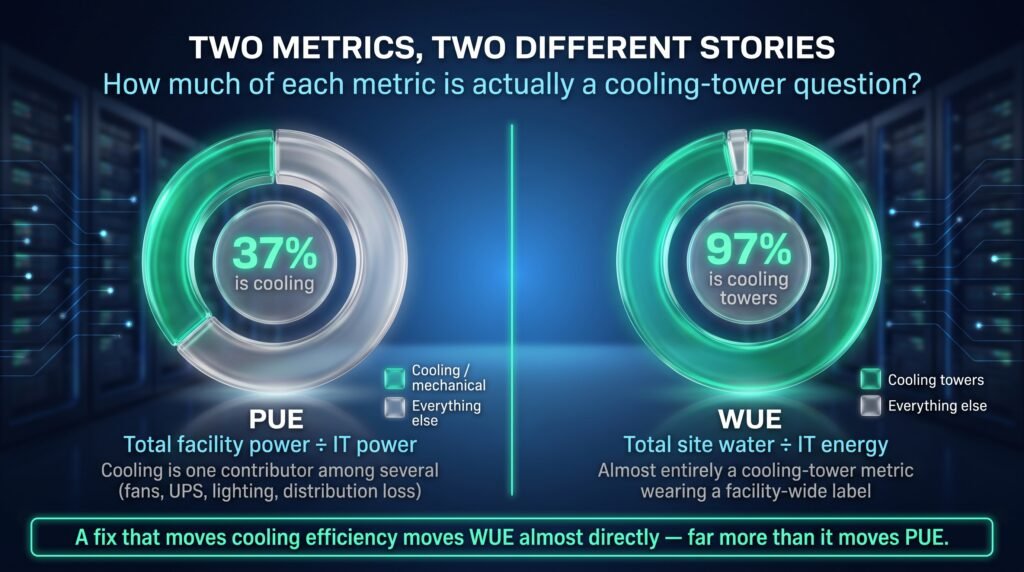
What makes WUE different from PUE is concentration of cause. Per NEA’s Data Centre Energy Efficiency Benchmarking study, cooling accounts for roughly 37% of a data centre’s total energy load — significant, but only just over a third of the picture. Water tells a much more lopsided story: the IMDA Green DC Roadmap confirms that cooling towers alone account for up to 97% of a data centre’s total water usage. WUE isn’t really a facility-wide water metric in practice — it’s almost entirely a cooling-tower metric wearing a facility-wide label.
Why Singapore Treats Water as a Strategic Metric, Not Just an Operating Line Item
Singapore has long treated water security as a national strategic priority, given its limited natural freshwater catchment relative to its population and industrial base — a context that explains why WUE targets sit alongside PUE targets in national data centre policy, rather than trailing behind as an afterthought. The scale of the issue nationally is substantial: the Public Utilities Board (PUB), Singapore’s national water agency, confirms in its Technical Reference for Water Conservation in Cooling Towers that more than 30 million gallons of water are consumed by evaporative cooling towers across Singapore every day. Data centre cooling towers are a meaningful contributor to that total, which is part of why water efficiency carries real regulatory and reputational weight for operators, not just a cost-control incentive.
Cycle of Concentration: The Lever That Actually Moves WUE
Cycle of Concentration (CoC) counts how many times the same water has been concentrated by evaporation in the cooling tower before being purged as blowdown and replaced with fresh make-up water. A higher CoC means less make-up water is needed to run the system over the same period — which maps almost directly onto a lower WUE, given how dominant cooling towers are in the water balance.
The achievable ceiling depends heavily on water source. According to PUB’s Technical Reference for Water Conservation in Cooling Towers (2017):
| Water Source | Without Acid Injection | With Acid Injection |
| Potable water | CoC 6–8 | CoC 10–15 |
| NEWater | CoC 8–17 | CoC 15–20 |
NEWater’s lower starting mineral content gives it meaningfully more headroom than potable water before scaling risk becomes the limiting factor — worth knowing if your facility has a choice of make-up water source, or is evaluating one.
The Ceiling Problem: Why CoC Doesn’t Just Go Up Forever
Acid injection aside, CoC can’t simply be pushed upward indefinitely. Every additional cycle concentrates dissolved minerals further, pushing the water closer to the supersaturation point that precedes scale formation. That’s precisely why CoC has a practical ceiling in the first place — and why many facilities run well below even the conservative end of the PUB ranges above, deliberately trading water efficiency for scaling safety.
In practice, chemically-treated systems commonly plateau in the 4–8 CoC range as chemical demand and cost escalate at higher concentrations, while facilities that have removed scale as the limiting factor through non-chemical treatment have reported sustaining meaningfully higher CoC — into the 8–10+ range, depending on water chemistry and system-specific conditions. These figures vary by site and should be treated as directional rather than guaranteed for any specific facility.
Translating CoC Into Actual WUE Movement
The relationship isn’t abstract. Improving CoC from 8 to 15, for example, can reduce blowdown volume by roughly 5% — a material saving at data centre scale, given how large a share of total site water consumption runs through the cooling tower to begin with. Because cooling towers account for up to 97% of total water use, a CoC improvement of this kind moves WUE far more directly than an equivalent efficiency gain would move PUE, where cooling is a smaller (though still dominant) share of the total.
What This Means for Operators Chasing the ≤2.0 WUE Target
Closing the gap between Singapore’s 2.2 m³/MWh median and the ≤2.0 national target doesn’t necessarily require new cooling tower capacity or major capital works. For many facilities, it starts with a simpler question: is today’s CoC setpoint based on a current, measured assessment of the system’s actual scaling risk — or a conservative default inherited from commissioning, never revisited since? Removing scale as the binding constraint is often what determines whether a facility can move from the lower end of the PUB ranges toward the upper end, without changing anything about the water source itself.
Non-chemical scale prevention technologies — including electromagnetic pulse-wave conditioning such as SWATS — are built on patented U.S. technology engineered specifically to remove that constraint, enabling a facility to safely sustain a higher CoC than a chemically-limited system typically can.
Sources
- National Environment Agency (NEA), Data Centre Energy Efficiency Benchmarking — source for the 37% mechanical/cooling share of total energy consumption: gov.sg
- Infocomm Media Development Authority (IMDA), Green Data Centre Roadmap (30 May 2024) — source for the WUE 2.2→≤2.0 m³/MWh target and cooling towers accounting for up to 97% of data centre water usage: gov.sg
- Public Utilities Board (PUB), Technical Reference for Water Conservation in Cooling Towers (2017) — source for the CoC-by-water-source table and the 30-million-gallon-per-day national figure: gov.sg


