
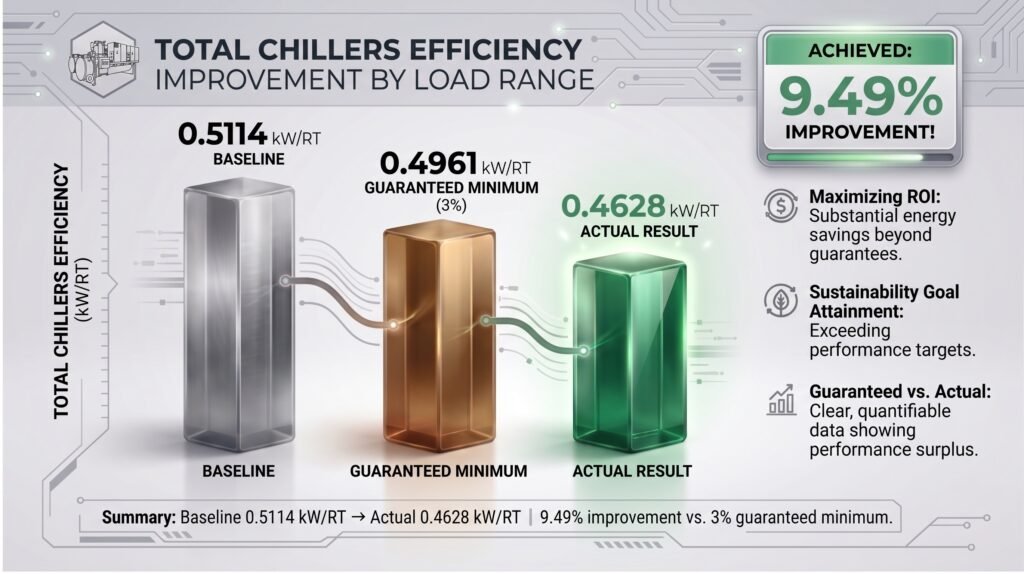
Most efficiency claims in this industry are estimates or projections. This one was a contractual guarantee — a minimum 3% improvement in chiller efficiency, formally measured against a documented baseline, verified through the client’s own Building Management System (BMS) over a fixed six-month period. The actual result came in at 9.49%, more than three times the guaranteed floor.
The Facility and the Challenge
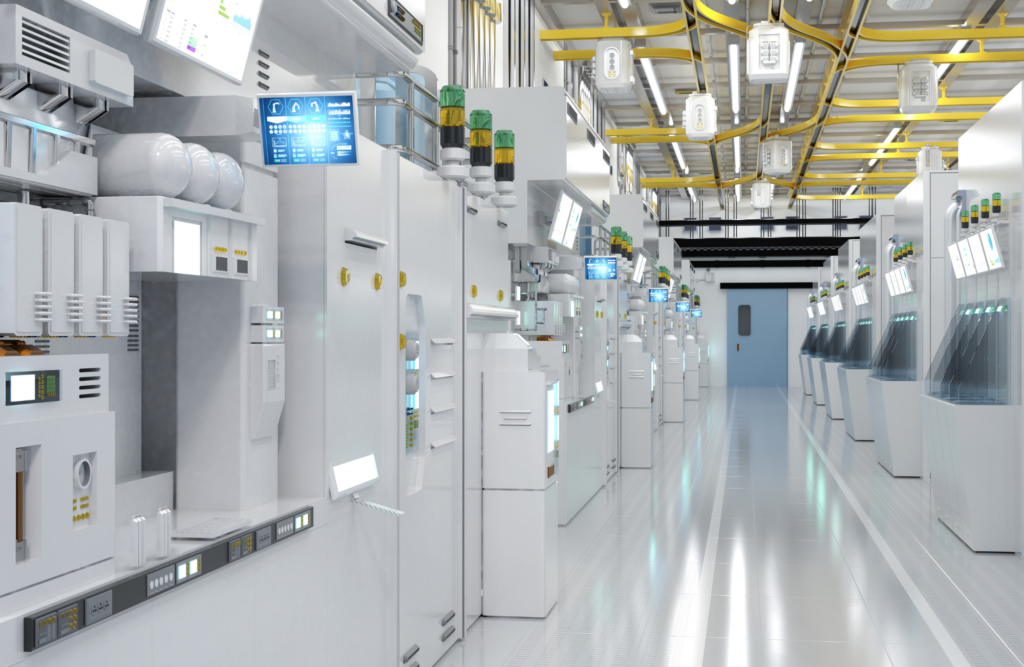
The client is a multinational semiconductor manufacturing facility in Singapore, operating a 7,000 RT water-cooled chiller plant that was five years old at the time of this project. Semiconductor manufacturing is a demanding environment for cooling infrastructure — high, sustained thermal loads running continuously — which makes any erosion in chiller efficiency a direct hit to both operating cost and the facility’s broader sustainability commitments. For this client specifically, two business drivers made the case: alignment with net-zero and decarbonization targets, and compliance support for Singapore’s Minimum Energy Efficiency Standards (MEES) for water-cooled chilled water systems.
What Was Installed
SWATS EMF technology were installed on the plant’s 32″ condenser main-header pipework. The installation was non-invasive by design — no cutting or welding into the existing pipework, and no moving parts in the units themselves, meaning no wear-and-tear risk and no scheduled downtime required to install or maintain the system.
A Guarantee, Not Just a Projection
What sets this case apart is the rigor of the commitment behind it. Rather than an estimated or modeled savings figure, the project was structured around a formal Measurement and Verification (M&V) process with a contractually guaranteed Key Performance Indicator (KPI): a minimum 3% improvement in overall chiller efficiency within six months of installation, measured against a documented pre-installation baseline.
That baseline was established over a dedicated two-week period (15–29 August 2024) before any equipment was installed. Following commissioning on 20 September 2024, performance was tracked continuously for six full months using data sourced directly from the client’s own BMS — not vendor-collected figures, but the client’s own building systems — with monthly performance updates provided throughout the monitoring period.
The Results
What This Means for Similar Facilities
This case illustrates two things worth separating. First, the underlying mechanism — restoring a chiller to its design efficiency by preventing scale formation in the condenser loop — produced a real, substantial result on a large, continuously-loaded industrial system, not just a small or marginal one. Second, and just as relevant for any facility evaluating a similar investment: a guaranteed KPI, backed by a formal baseline and independently-sourced monitoring data, is a meaningfully different kind of claim than a projected savings estimate. For facilities teams and ESG specialists weighing vendor claims generally, that structure — a specific number, a specific measurement method, and a specific verification source — is what separates an accountable claim from an aspirational one.
For manufacturing facilities pursuing net-zero targets or navigating MEES compliance specifically, this case reflects exactly the kind of documented, verifiable reduction those frameworks are built to recognize.
* Results vary according to actual scaling conditions and system parameters. Case study data drawn from HannveTech’s own Six-Month Performance Review report (dated 31 March 2025), prepared under a formal Measurement and Verification process. Client identity withheld in accordance with a non-disclosure agreement.


